

Understanding Hammer Candlestick Patterns in Trading
🔍 Learn to spot hammer candlestick patterns in trading! Understand their signals, use with other indicators, and trade stocks or forex more effectively.
Edited By
Daniel Reid
Continuation candlestick patterns offer traders a practical way to gauge whether a current trend is likely to carry on. Instead of signalling a reversal, these patterns suggest that momentum is still strong, making them useful for confirming trading setups or deciding when to hold a position.
Recognising continuation patterns helps you avoid premature exits and can improve timing for entries during trend pauses or consolidations. For example, if a share price is increasing steadily, a continuation pattern might indicate the upward move isn't done yet.

These patterns form during brief pauses where price action takes a breather, often showing indecision or reduced volatility before pushing in the same direction. Understanding the typical behaviours of these patterns within a chart can lead to smarter decisions and reduce risk.
Continuation patterns don’t guarantee the trend will last forever, but they increase the odds of trend persistence when combined with volume and broader market context.
Some common continuation candlestick patterns include:
Rising Three Methods: Shows a series of small bearish candles sandwiched between two strong bullish candles, indicating a brief pullback inside an uptrend.
Falling Three Methods: The inverse, signalling a momentary pause in a downtrend.
Flags and Pennants: Though primarily chart patterns, candlestick shapes within these formations confirm continuation after consolidations.
To spot these effectively, keep an eye on where they appear in the trend, their size relative to previous moves, and accompanying volume changes. In a strong trend with steady volume, continuation signals are much more reliable.
For South African traders dealing with volatile sectors, like mining or the JSE-listed financial companies, applying knowledge of continuation patterns can help ride trends through choppy markets. Remember, no pattern works in isolation—combine them with other tools like moving averages, support and resistance levels, or momentum indicators.
Ultimately, understanding continuation candlestick patterns empowers you to stay with the trend longer and avoid getting shaken out by normal market hiccups. This sets a solid foundation for profitable trading and investing.
Continuation candlestick patterns signal that the existing price trend—whether up or down—is likely to carry on. For traders and analysts, recognising these patterns can help them stay on the right side of market momentum instead of jumping ship too early or entering at a poor moment. Unlike reversal patterns that hint a trend might change direction, continuation patterns offer clues that the market is taking a breather before pressing forward.
Trend persistence means that the price movement maintaining its direction over a stretch of time is expected to continue. For example, if a share on the JSE has been trending upwards, a continuation pattern found on its chart suggests that rather than dropping, it might pause briefly before pushing higher again. These pauses are like short breaks in a marathon—brief rests but no surrender.
This kind of pattern lets traders anticipate sustained moves rather than guessing wildly. It basically offers a green light to keep holding a position or enter a trade aligned with the prevailing direction, leveraging the ongoing momentum.
Continuation patterns differ from reversal patterns in what they signal about market psychology. Reversal patterns suggest that buyers or sellers are losing strength, and the price could flip direction. Meanwhile, continuation patterns reflect that the market is gathering energy to persist in the same direction after a pause.
Understanding the distinction matters because acting on a reversal signal when it’s actually a continuation (or vice versa) can lead to missed opportunities or losses. For instance, mistaking a rising three methods pattern (a bullish continuation) for a reversal might have you selling prematurely in a rising market.
Continuation patterns help traders manage risk by confirming that the current trend isn’t faltering. When these patterns appear alongside other indicators—like volume or moving averages—they reduce uncertainty about whether it’s safe to stay invested or increase a position.
A trader spotting a falling three methods pattern on a share like Sasol’s, while volumes remain steady, might choose to hold onto their short position confidently rather than close out prematurely and lose potential profit.
Timing can make or break a trade. Continuation patterns provide clues on when to enter or exit based on the market's likely next move. Ignoring them might mean jumping in too soon or exiting too late.
For example, a trader might wait for confirmation of a mat hold pattern on a commodity stock before entering, rather than rushing in as soon as prices dip. This patience often leads to better-priced entries and improved returns.
Candlestick patterns don’t exist in isolation. Continuation patterns add depth to understanding the broader market context, such as identifying pauses in momentum or temporary reactions to news within a strong trend.
This awareness helps traders adjust strategies, recognising that sideways movements or minor pullbacks may be just temporary. For example, during Eskom’s loadshedding impact on financial shares, continuation patterns could indicate these are brief pauses rather than trend reversals, informing smarter decision-making.
Recognising continuation candlestick patterns equips traders with practical insights to navigate trending markets confidently, improving timing, risk control, and overall strategy alignment.
Recognising common continuation patterns is a solid way to confirm that a trend is likely to stick around. This knowledge can help traders avoid jumping the gun or second-guessing when the market still has momentum in the same direction. These patterns provide clear signals rooted in price action, making them a practical tool for improving entry and exit timing.
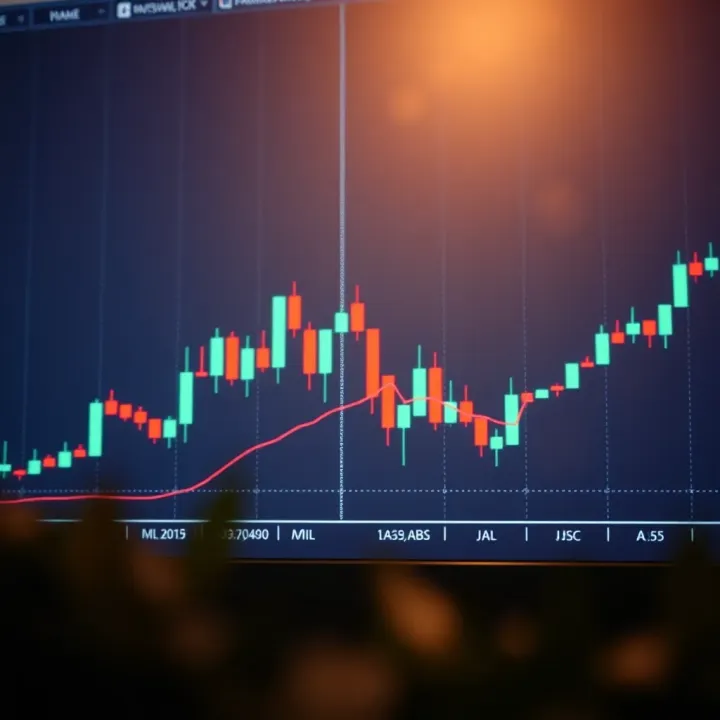
The Rising Three Methods is a classic bullish continuation pattern. It begins with a strong upward candle showing decisive buying. This is followed by three smaller bearish or neutral candles that trade within the range of the first candle’s body. None of these pullbacks close below the start of the move, which keeps the overall integrity of the bullish trend intact. Finally, a strong bullish candle closes above the first candle's high, confirming the uptrend.
This formation shows investors that while there’s a short pause or mild retracement, the bulls remain firmly in control. For instance, a JSE-listed stock like Naspers Ltd might display this pattern during a sustained run, signalling traders to hold or add to positions.
When the last candle in the Rising Three Methods closes higher, it confirms buyers have regained control after a brief consolidation. This typically signals the upward momentum is set to continue. Traders can use this pattern to enter long positions confidently, knowing there’s a lower chance of a reversal.
Besides entry timing, it also helps in placing stop-loss orders just below the minor pullback zone, giving trades some breathing room during volatility. This pattern works best along established uptrends with supportive volume confirmation.
The Falling Three Methods mirrors its bullish counterpart but signals bearish continuation. It starts with a long strong bearish candle, representing selling pressure. This is followed by three small bullish or sideways candles that stay within the first candle’s range, indicating a weak pause rather than a full reversal. The pattern finishes with a strong bearish candle closing below the first candle’s low, signalling sellers have resumed dominance.
This pattern can appear in shares like Sasol or Shoprite during prolonged downtrends, warning traders to remain cautious or consider short positions.
A completed Falling Three Methods pattern implies sellers hold the reins after a short-lived respite. The final bearish candle’s close below the initial candle’s low is a clear signal that the downtrend persists. Traders might use this as a cue to short the market or tighten stops on existing longs.
It’s particularly useful in volatile markets where false reversals can unsettle strategies. Waiting for the confirmation candle reduces exposure to whipsaw moves.
Harami patterns consist of a large candle followed by a smaller candle entirely contained within the first body, signalling indecision. The Harami Cross variant replaces the smaller candle's body with a doji, reinforcing uncertainty. Though often considered reversal signals, these can also indicate a pause during trends.
In trending markets, noticing a Harami or Harami Cross hints traders to watch for possible continuation as the market digests recent moves. For example, during an uptrend in a currency pair like USD/ZAR, a Harami may signal temporary hesitation before price resumes upward.
While the small candle suggests some hesitation, its containment within the previous candle's range shows the dominant trend isn’t yet broken. Traders often interpret this as the market taking a breath before continuing the trend, rather than flipping direction.
Effective use involves confirming these patterns with volume and other indicators to avoid misreading a genuine reversal as mere consolidation.
The Mat Hold forms during an ongoing trend and looks like a strong candle, followed by several small candles that gently retrace but stay within the initial candle’s range, then closed with another strong candle in the original trend’s direction. It signals healthy consolidation rather than a trend change.
For example, on an index like the FTSE/JSE Top 40, a Mat Hold pattern during an upswing suggests steady buying interest despite minor pullbacks.
This pattern hints that traders are taking a short break, consolidating gains before pushing the price onward. The final candle closing decisively in trend direction validates the move and gives traders confidence to hold or enter.
Additionally, risk management improves by placing stops near the consolidation zone, offering a clear exit if the market shifts unexpectedly.
Recognising these patterns provides traders and investors with concrete signals to stay with the trend and manage trades confidently, especially when combined with volume and broader market analysis.
By familiarising yourself with these common continuation candlestick formations, you gain practical tools for reading market rhythm and positioning trades for better outcomes in South African markets and beyond.
Looking at continuation candlestick patterns without context is like reading a map with no compass. To make these patterns genuinely useful, you need to consider what’s happening around them, such as volume, key price levels, and other technical signals. This approach helps filter out noise and avoid false positives, giving you a clearer picture of whether a trend is likely to continue or not.
Volume is the fuel behind price moves. When a continuation pattern forms, ideally, you want to see volume backing it up. For example, in a rising three methods pattern, volume typically dips during the small consolidating candles but then spikes on the breakout candle. This volume surge confirms that buyers (or sellers) are still in control, making the pattern more trustworthy.
A lack of volume can warn you the move may be weak or temporary. Imagine a falling three methods pattern forming with declining volume – this could indicate sellers are tiring, reducing the chance the downtrend will hold. Monitoring how volume changes during these patterns gives you practical insight into the strength of market participants and the likelihood the trend will carry on.
Support and resistance levels act as psychological and technical markers that the market respects. Continuation patterns appearing near these levels matter more because these zones often dictate price behaviour. For instance, a harami pattern forming near a strong support level during an uptrend could suggest a brief pause before prices push higher.
Patterns near resistance levels should be treated with caution. Take the mat hold pattern near a well-established resistance zone—prices might struggle to break through, signalling consolidation rather than continuation. By paying attention to where patterns emerge relative to these key price points, you can make smarter calls on whether to enter, hold, or exit trades.
Moving averages smooth out price fluctuations, giving a clear line to track the trend direction. When a continuation pattern forms and the price remains above a relevant moving average (like the 50-day MA), it strengthens the trend continuation case. Conversely, if the price drops below the moving average, the pattern’s reliability diminishes.
For example, spotting a falling three methods pattern on a share listed on the JSE while the 100-day moving average slopes down adds weight to a continuing downtrend. Moving averages help confirm whether the broader trend supports the candlestick signals.
Momentum indicators like the Relative Strength Index (RSI) add another layer of confirmation. If a continuation pattern appears but the RSI shows overbought or oversold conditions, the pattern’s reliability can be questionable.
Say a rising three methods forms but the RSI is already above 70; this suggests caution as the market might be overheating. On the other hand, if the RSI is in the mid-range and rising alongside the pattern, it points to ongoing momentum, reinforcing the likelihood the trend will last.
Combining continuation patterns with volume, support/resistance, and other indicators helps you avoid traps and improves your chances of making confident trading decisions.
Trading with continuation candlestick patterns demands more than just recognising formations — you need practical strategies to turn them into solid trades. This section covers how to enter and exit trades wisely, manage risks by spotting false signals, and apply these ideas specifically within South African markets.
Identifying optimal entry points is key. Traders often wait for confirmation beyond the pattern itself, such as a breakout on above-average volume or a close beyond resistance or support levels. For example, spotting a Rising Three Methods pattern near a strong support on the JSE could suggest a good time to enter a long position. Entering too early risks being caught in a false breakout, while delay might mean missing better prices.
Setting stop-loss levels protects your capital if a trend doesn’t hold. A common practice is placing a stop just below the low of the continuation pattern or recent swing low in a bullish trend. This means if the price unexpectedly moves against your position, losses get capped. For instance, with the Falling Three Methods bearish continuation, a stop-loss slightly above the highest candle in the pattern offers a safety net.
Timing exits to protect profits involves monitoring for signals of trend exhaustion or reversal. Traders often trail stop-loss orders behind rising lows to lock in gains as the trend progresses. If a candle pattern suggests weakening momentum, such as a Harami Cross near resistance, it might be time to gradually exit. Being patient but cautious ensures you don’t give back profits needlessly.
Confirming signals with volume and trend makes your trades more reliable. Volume spikes during the pattern, especially on breakouts, confirm genuine market interest. Combine candlestick readings with broader trend indicators like moving averages to spot the prevailing direction. Without this, continuation patterns sometimes appear in choppy or sideways markets, increasing risk.
Watch-outs for common pattern misinterpretations include mistaking reversal signals for continuation, or ignoring the wider market context. For example, a Mat Hold pattern might look bullish, but if trading near a strong resistance or in a downtrend, it could fail. Also, watch for patterns on low volume or outside normal trading hours, as these tend to be weaker signals.
Illustrations using JSE-listed shares help bring theory to life. Take Sasol or Naspers — both have shown clear Rising Three Methods setups during sustained rallies. Observing volume and support levels alongside these patterns gave local traders confidence to hold or add to positions. Such examples prove continuation patterns aren’t just textbook exercises but practical tools in Mzansi’s equities scene.
Considerations unique to South African market conditions include factoring in loadshedding disruptions and political news impacts, which can create false breaks or unusual price swings. Local holidays and economic data releases also affect volume and volatility, altering how patterns behave. Traders should blend candlestick analysis with awareness of these realities to avoid being blindsided.
Practical trading means combining candlestick patterns with sound entry tactics, risk management, and local market savvy. This approach can help you spot ongoing trends and protect your money from the unexpected.
Understanding continuation candlestick patterns is crucial for traders looking to ride existing trends rather than guessing reversals. These patterns suggest that the current price movement will carry on, helping you avoid premature exits or entries that go against the trend. Given how often the market tests and retests levels in South Africa’s JSE or broader global equities, a well-timed trade using these patterns can protect capital and secure profits.
The Rising Three Methods signal a bullish continuation, formed by a strong upward candle followed by several smaller bearish candles, and then a final large bullish candle pushing prices higher. Conversely, the Falling Three Methods indicate a bearish continuation, shown by a strong downward candle, a few small bullish candles, then a large bearish candle confirming the downtrend. Harami patterns—both standard and Harami Cross—highlight moments of pause in a trend, where the market consolidates before continuing. Finally, the Mat Hold pattern reflects brief retracement against the prevailing trend, often signalling sustained momentum once complete.
Each pattern tells a story about the tug of war between buyers and sellers. For instance, in volatile times like during Eskom load shedding announcements, spotting a strong Rising Three Methods can signal that despite the noise, buyers remain in control. These patterns thrive when you interpret them within the context of volume, support, and resistance.
Firstly, always confirm continuation patterns with volume spikes; higher volume usually backs the move’s validity. It's wise to combine pattern analysis with other indicators like moving averages to filter out false signals—say, a 50-day simple moving average to confirm the trend direction. Setting stop-loss orders just below a support level when entering trades based on continuation patterns helps protect against unexpected reversals.
Real-life trading in South Africa’s markets shows that relying solely on patterns without considering the bigger picture can lead to costly mistakes. For example, a Mat Hold pattern appearing near a strong resistance level without volume support might fail, triggering losses. Therefore, always contextualise patterns with other technical tools and local market conditions, including currency volatility and retail sentiment.
Continuation candlestick patterns should be seen as part of a broader toolkit. They offer valuable hints but are most effective when combined with sound risk management and market awareness.
To sum up, knowing these patterns and applying them carefully can improve your market timing significantly. They reduce guesswork and, when handled properly, support steady gains in the dynamic trading environments common to South Africa and beyond.
🔍 Learn to spot hammer candlestick patterns in trading! Understand their signals, use with other indicators, and trade stocks or forex more effectively.

📈 Discover high-profit candlestick patterns with practical tips to boost your trading strategy. Learn to spot key signals and access PDF guides easily.

Explore key concepts of fundamental forex trading 📊 Understand economic indicators, central banks, and geopolitical factors to master currency market moves 💹

📈 Explore practical forex trading strategies designed for real-world success. Get free PDFs to master currency markets and boost your trading skills today!
Based on 14 reviews