

Best Forex Trading Platforms for South African Traders
Find the best forex trading platforms for South African traders 🇿🇦. Discover key features, fees, and local rules to trade confidently and safely trading forex.
Edited By
Emily R. Thompson
Fibonacci trading techniques are widely used among forex traders for their ability to identify potential reversal points and establish entry or exit levels. For South African traders, mastering these tools can offer a clearer edge in the fast-moving and often volatile forex market.
Fibonacci retracement and extension levels arise from a sequence of numbers first described by the Italian mathematician Leonardo Fibonacci in the 13th century. These levels — primarily 23.6%, 38.2%, 50%, 61.8%, and 100% — serve as markers where price tends to pause or reverse. This happens because many traders watch these levels, creating a self-fulfilling pattern.

Understanding how to spot these key levels on a forex chart is essential. For example, say the USD/ZAR pair has rallied from 15.00 to 15.50; a pullback to the 61.8% retracement level around 15.31 might signal a solid buying opportunity if supported by other signs.
When combining Fibonacci levels with price action and indicators such as moving averages or RSI (Relative Strength Index), traders can confirm the validity of a potential trade set-up. It’s not enough to rely on these levels alone; looking for price patterns, candlestick signals, or momentum shifts can improve accuracy significantly.
Successful forex trading in South Africa demands disciplined risk management. Applying stop-loss orders just beyond Fibonacci levels helps protect your capital from unexpected swings caused by local economic news or Eskom load-shedding disruptions.
In practical terms, South African traders need to build a framework around Fibonacci strategies by integrating market context, realistic expectations, and strict money management. Forex is unpredictable, so keeping position sizes manageable and setting clear targets improves long-term results.
To sum up, Fibonacci tools provide actionable reference points for timing and direction in forex trading. The trick is to apply them wisely, side by side with sound risk control and observant chart reading tailored to the South African market nuances.
Understanding Fibonacci levels offers traders a method to spot potential turning points in the forex market. These levels act as guides where price may stall, reverse, or break through, helping traders make more informed decisions about entries, exits, and stop-loss placements. For South African forex traders, who often navigate volatile markets affected by global currency shifts and local economic factors, recognising these levels is crucial for timing trades effectively.
Fibonacci numbers form a sequence where each number is the sum of the two preceding ones, starting from 0 and 1. This mathematical pattern appears frequently in nature, from the arrangement of leaves to the spiral of seashells. Traders picked up on these ratios because price movements often seem to respect similar proportions, hinting at natural market rhythms.
The key Fibonacci ratios derived from this sequence include 23.6%, 38.2%, 50%, 61.8%, and 78.6%. These percentages represent retracement levels that price tends to return to before resuming its previous trend. For instance, after a sharp rise in a currency pair like USD/ZAR, the price might pull back to the 61.8% retracement level before climbing again. These ratios offer quantifiable points to watch rather than relying solely on guesswork.
Forex markets, including pairs popular in South Africa like the EUR/ZAR or GBP/ZAR, are influenced by trader psychology and natural order. Fibonacci levels highlight price zones where traders often expect reactions due to collective behaviour around these numbers. This awareness provides a framework to anticipate support and resistance, making trading more strategic and less speculative.
Moreover, these levels can be combined with other tools like candlestick patterns or moving averages to strengthen trading signals. This integration helps traders avoid false alarms and align entries with higher-probability setups.
Retracement involves measuring a price pullback within an existing trend. To draw these levels on a chart, pick the swing low and swing high in an uptrend or swing high and swing low in a downtrend. Popular trading platforms used by South Africans, such as MetaTrader 4 or TradingView, include drawing tools that automatically plot these retracement lines. For example, if the USD/ZAR climbs from 15.00 to 15.50, retracement levels help you predict where price might dip before pushing higher again.
Extensions, on the other hand, aim beyond the original move to set profit targets or potential breakout levels. These are measured by extending Fibonacci ratios past the swing high or low. If a pair like EUR/USD moves from 1.10 to 1.15, a 161.8% extension would mark where traders might consider taking profits on long positions.
Understanding the difference between retracements and extensions is vital. Retracements expect price to pull back temporarily within a trend, while extensions look for where price might stretch after the trend resumes. Mixing them up could lead to mistimed trades or misplaced stops.
Knowing how to correctly identify and use Fibonacci retracement and extension levels equips you with a practical edge in forex trading. It’s like having a measured ruler in a market often swayed by emotion and noise.
Together, these concepts ground a trader’s approach in measurable, repeatable points, helping South African traders navigate fast-moving markets confidently and with clearer expectations.
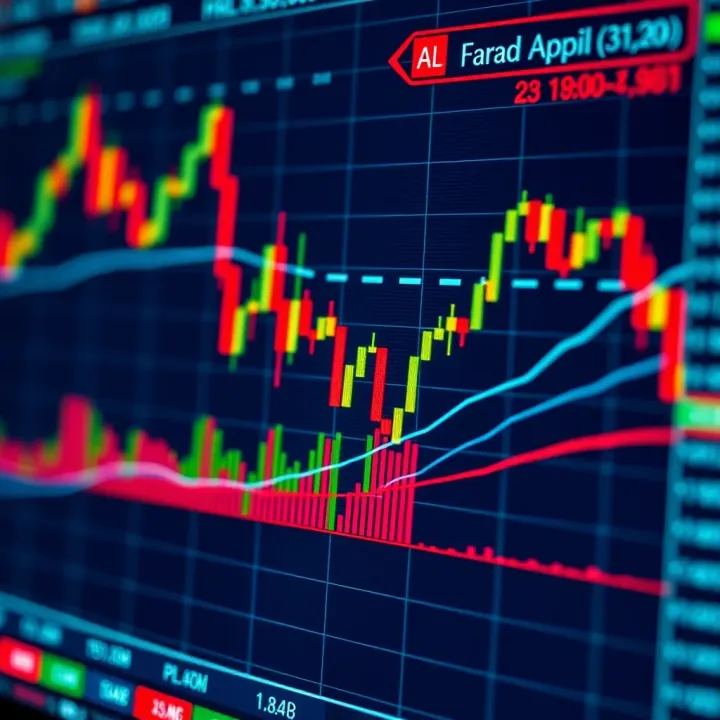
Applying Fibonacci levels in forex trading is about more than just drawing lines on a chart. When used effectively, these levels help traders spot potential turning points where price action might pause or reverse. For South African traders, who often deal with volatile forex pairs and localised market shocks like sudden rand shifts, combining Fibonacci with other tools can sharpen decision-making and timing.
Using candlestick patterns near Fibonacci zones helps confirm potential trade setups. When the price approaches a key Fibonacci retracement level—say, 38.2% or 61.8%—traders watch for telltale candlestick patterns like pin bars, engulfing candles, or dojis. These patterns signal market hesitation or reversal, adding weight to the Fibonacci level’s significance. For instance, seeing a bearish engulfing candle form exactly at the 61.8% retracement could signal a good sell opportunity.
Price action like this provides an extra layer of confirmation beyond just relying on Fibonacci numbers alone. Without this, those levels can sometimes feel like arbitrary lines, leading to poor trade entries.
Recognising support and resistance at Fibonacci levels is another key practice. Over time, certain Fibonacci levels become self-fulfilling pillars of support or resistance because many traders watch and act on these points. For example, if the rand/dollar pair consistently bounces off the 50% retracement level on various timeframes, that zone gains credibility as a strong support area.
Traders can combine this insight with volume analysis or previous swing points to time entries and exits better. Knowing where these natural barriers lie helps avoid chasing trades or entering at weak points.
Supporting Fibonacci with moving averages removes guesswork from trend identification. Imagine the 50-day moving average converging with the 38.2% Fibonacci retracement. This cluster is often tougher resistance or support, improving the odds of a meaningful price reaction.
Moving averages also provide dynamic support and resistance compared to fixed Fibonacci lines. Many South African traders use combinations like the 20, 50, and 200 moving averages to read overall trend context alongside Fibonacci zones.
RSI and stochastic indicators near Fibonacci points further enhance trade validation. When the price hits a Fibonacci level and the relative strength index (RSI) shows overbought conditions, it hints at a possible price drop. Conversely, if the stochastic oscillator registers oversold near a key extension level, you might expect a bounce.
These momentum indicators help filter false signals and improve the accuracy of entries and exits. For example, seeing the RSI above 70 near the 61.8% retracement warns of exhaustion in the move, a cue to tighten stops or prepare a trade reversal.
Combining Fibonacci levels with price action and technical indicators creates a more reliable framework. It helps South African traders manage the ups and downs of a fluctuating forex market with clearer signals and better timing.
By integrating these elements thoughtfully, you can avoid common pitfalls and turn Fibonacci into a practical tool rather than just theoretical jargon.
Having a solid trading plan centred on Fibonacci levels is key to turning theory into real profits in the forex market. South African traders often juggle market volatility with local factors like Rand weakness and global sentiment shifts. A practical plan helps manage these uncertainties by setting clear guidelines for entries, exits, and risk.
Setting entry points on retracement bounces usually involves looking for the price to pull back to a key Fibonacci retracement level—commonly the 38.2%, 50%, or 61.8% levels—before resuming the trend. For example, if the USD/ZAR pair has rallied sharply, a retracement to the 50% Fibonacci level could offer a safer entry point near support. Waiting for confirming signals like a bullish candlestick pattern at these levels reduces the risk of jumping in too early.
Using Fibonacci extensions for profit targets means that once you enter on a retracement, you use the extension levels (like 127.2% or 161.8%) to estimate where the price may move next. These extensions act as logical, objective profit targets. Take a scenario where the GBP/ZAR bounces at the 61.8% retracement; traders might set the first target just below the 127.2% extension to lock in gains before the market potentially pulls back.
Determining stop-loss positions around Fibonacci levels is about protecting your capital if the trade doesn’t go as expected. Placing the stop-loss just below the next Fibonacci level beyond your entry point is a common tactic. For instance, if you buy the EUR/ZAR at the 50% retracement, a stop just below the 61.8% level limits your losses if the price plunges further, while still allowing room for normal market noise.
Choosing suitable timeframes for Fibonacci analysis depends on your trading style and strategy. Swing traders in Johannesburg might favour 4-hour or daily charts for clearer Fibonacci levels with less noise, whereas scalpers could use 15-minute charts for faster execution. However, relying solely on very short timeframes can increase false signals, so testing what timeframe aligns with your comfort and risk tolerance is essential.
Adapting strategies to trending and ranging markets means recognising when Fibonacci levels are more reliable. In a strong trending environment like when the Rand is weakening against the USD due to political uncertainties, Fibonacci retracements often act as better support or resistance zones. But during sideways or ranging markets, Fibonacci levels can generate whipsaws—so it helps to mix in oscillators or only take trades near the extremes of the range. This flexibility prevents chasing trades where the market lacks clear direction.
A disciplined Fibonacci trading plan sets the stage for consistent decision-making, helping South African traders navigate unpredictable forex markets more confidently and efficiently.
Managing risks and expectations is key when trading with Fibonacci levels, especially for South African traders navigating volatile forex markets. While Fibonacci retracements and extensions offer helpful reference points, they’re not foolproof signals. Setting clear boundaries on potential profits and losses can protect your capital from unexpected market swings and reduce emotional stress. In practical terms, this means pairing Fibonacci analysis with solid risk management rules and realistic expectations.
When using Fibonacci levels to plan trades, a sensible risk-to-reward ratio is crucial. For example, entering a trade near the 61.8% retracement level and aiming for the 161.8% extension as a profit target offers a natural reward multiple compared to the stop-loss placed just beyond the 78.6% retracement. If you risk R500 on the stop-loss, your target should comfortably exceed R1,000 in potential profit to justify the trade. This disciplined approach helps balance risk and reward, preventing you from chasing trades with poor outlooks.
False breakouts near Fibonacci levels are common and can catch traders off-guard. For instance, a price might briefly dip below a 50% retracement before bouncing back, tempting traders to exit prematurely or enter too soon. To combat this, wait for confirmation such as a close beyond the level on your chosen timeframe or additional signals from other indicators. Pullbacks can also test these levels multiple times before continuing the trend, so patience is essential to avoid being shaken out prematurely.
Sticking to a well-structured Fibonacci trading plan is tough but necessary. Many traders fall into the trap of moving stops or targets out of fear or greed. For example, when a trade approaches a Fibonacci extension target, the temptation to keep the position alive hoping for more gains can be strong, but it increases exposure to reversals. Writing down your entry, stop-loss, and take-profit based on Fibonacci levels before the trade helps maintain discipline and remove emotional decision-making.
Forex markets can be unpredictable despite clear Fibonacci setups. Accepting that losses and unexpected moves happen prevents frustration and rash decisions. South African traders should avoid overtrading, especially during high volatility such as Eskom load shedding days when market liquidity can thin out. Focus on quality trades that match your Fibonacci strategy instead of chasing every signal, which only burns through your capital and confidence.
Successful Fibonacci trading isn’t about perfect predictions; it’s about managing risk wisely and sticking to your plan even when the market throws curveballs.
By managing risk and expectations carefully, your Fibonacci trades gain a practical edge, helping you navigate the market more confidently and sustainably.
Using the right tools can make a significant difference in how effectively you apply Fibonacci strategies in forex trading. For South African traders, it's not just about having access to any charting software but choosing platforms that offer clear, user-friendly Fibonacci tools that integrate well with local market conditions and data feeds.
Several trading platforms stand out among South African traders for their reliable Fibonacci functions. MetaTrader 4 (MT4) remains popular due to its familiarity and vast support community, allowing traders to draw precise retracement and extension levels with ease. Locally supported platforms like ThinkMarkets or TradeForexSA also provide integrated Fibonacci tools tailored for the volatile forex pairs frequently traded in Mzansi.
Setting up Fibonacci levels correctly requires knowing when and where to apply them on your charts. Begin by selecting the significant high and low points within your chosen timeframe—this can be a recent swing high and low or a longer-term trend extremity. Drawing Fibonacci retracements between these points reveals potential support and resistance zones. It's important to use multiple timeframes for confirmation, for example, drawing retracements on a 4-hour chart and then checking those zones on your daily chart to strengthen your trade decision.
Beyond basics, modern charting software often allows you to customise the Fibonacci levels displayed, adding commonly used ratios like 38.2%, 50%, 61.8%, and extensions such as 161.8%. Learning to adjust these tools flexibly can improve how you spot entry points and profit targets, especially during unpredictable periods when the Rand experiences volatility.
Learning about Fibonacci trading isn’t limited to just reading articles. South African traders benefit from both local and international courses that explore Fibonacci applications in depth. Platforms like SAFX and Forex School Online offer courses focusing on practical trading techniques, including how to combine Fibonacci with price action and risk management tailored to Mzansi’s market nuances.
Engaging with online trading communities and forums, such as the MyBroadband Forex Forum or international groups on platforms like Reddit and Telegram, supports continuous learning. These spaces often have members who share their Fibonacci trading experiences, discuss challenges faced during local market conditions like Eskom loadshedding affecting trading sessions, and provide feedback on strategy tweaks. Joining such groups keeps you updated on trends and pitfalls while allowing you to test ideas before applying them live.
Tools and resources aren’t just about technology; they form the backbone of building your Fibonacci trading expertise. Accurate set-up, ongoing education, and community support work hand in hand to help you trade smarter, not harder.
These resources help South African traders understand Fibonacci levels better and apply them with confidence to local and global forex pairs, improving their chances of trading successfully amid dynamic market conditions.
Find the best forex trading platforms for South African traders 🇿🇦. Discover key features, fees, and local rules to trade confidently and safely trading forex.

📈 Discover comprehensive forex trading software insights tailored for South African traders. Explore types, features, pros, and cons to trade smarter today!
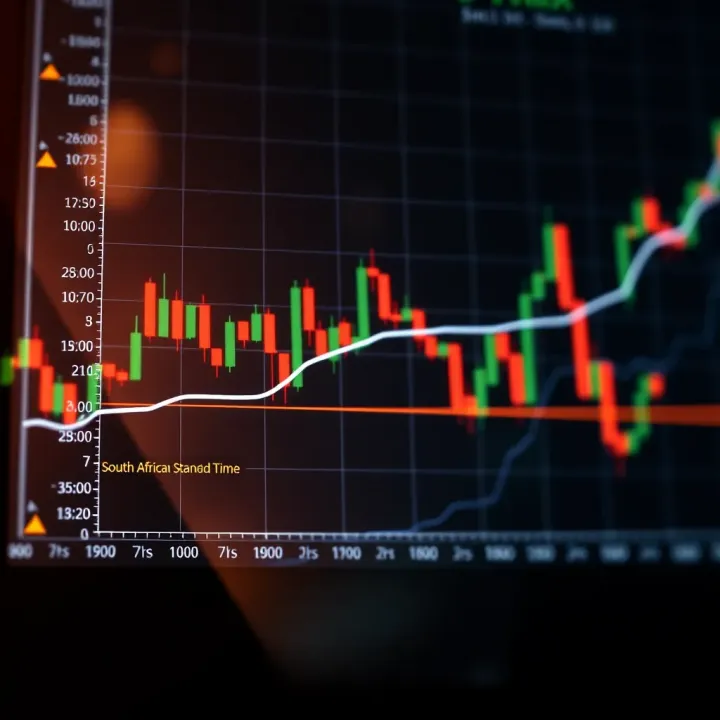
📊 Learn the key forex trading sessions for South African traders, their SAST timings, and handy tips on using session PDFs for smarter trading decisions.
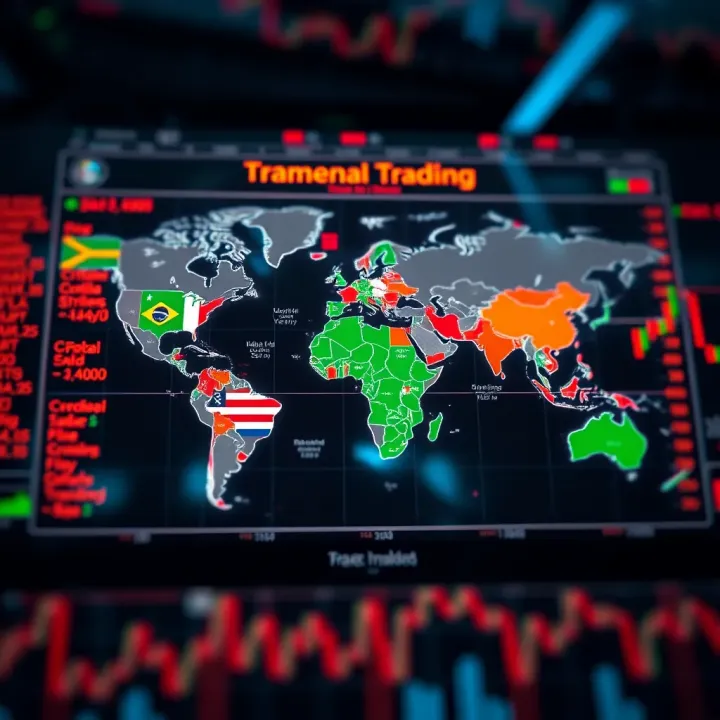
🌍 Explore global forex trading essentials & risks, top currency pairs & strategies tailored for South African traders. Stay informed and trade smart! 💹
Based on 7 reviews