
Guide to Candlestick Patterns in Trading
📈 Master candlestick patterns for smarter trading. Learn how to spot market shifts, improve entries and exits with clear guides on price action signals. 📊
Edited By
Daniel Wright
Candlestick charting is a staple tool for many South African traders on the Johannesburg Stock Exchange (JSE) and beyond. Unlike simple line charts, candlesticks display more nuanced price information — opening, closing, highest, and lowest prices — all packed into visually distinct shapes. These shapes form patterns that can hint at potential market direction and momentum.
Understanding and recognising these patterns can sharpen your decision-making by signalling possible reversals or continuation moves in stocks, forex, or commodities traded locally or internationally. For example, spotting a hammer pattern after a downtrend could signal a buying opportunity, while a shooting star after an uptrend may warn of a forthcoming dip.

Candlestick patterns aren’t magic spells. They offer visual cues based on market psychology, but always work best when combined with other tools, like volume analysis or support and resistance levels.
The JSE experiences unique factors like local economic announcements, interest rate changes from the South African Reserve Bank (SARB), and even Eskom’s loadshedding schedules — all affecting price action. Candlestick patterns can help you filter noise and focus on actual shifts in trader sentiment.
Moreover, many domestic brokers provide platforms enabling straightforward access to candlestick charts, allowing traders to act swiftly. Learning to read these patterns reduces guesswork, helping you manage risk better in a market sensitive to both local and global developments.
Get familiar with basic candle anatomy: body, wick (shadow), and colour.
Start with widely used patterns such as the Doji, Engulfing, and Hammer.
Practise spotting these on daily or intraday charts for stocks like Sasol or Naspers.
Use patterns as part of an overall strategy that includes stop-loss orders and position sizing.
By grounding your trading in these clear visual signals, you’re better equipped to tackle the waves of the markets with confidence and precision, even when the rand fluctuates unexpectedly or global markets swing.
This guide will take you through the essential patterns, pitfalls to avoid, and how to blend candlestick analysis seamlessly with your existing toolkit.
Getting a good grasp of candlestick basics is key for South African traders who want to read charts well and make smarter decisions. Candlesticks aren’t just colourful shapes on a chart — they tell the story of price movement within a specific timeframe. Unlike simple line charts that only show closing prices, candlesticks give more detail on price action, revealing where the price opened, closed, and how far it fluctuated in between.
Each candlestick summarises trading activity in a chosen time period, whether that’s one minute, an hour, or a whole day. It shows the opening price, closing price, highest price, and lowest price during that period. For example, if you’re watching the JSE Top 40 index on a daily chart, every candle depicts a full day’s movement—from the opening level when the market starts to trade, to the closing level when it shuts down. This snapshot helps in judging market sentiment and potential reversals.
Understanding a candlestick’s structure makes pattern reading much clearer. The ‘body’ is the thick part; it represents the price range between the opening and closing levels. The ‘wicks’ or ‘shadows’ are thin lines sticking out at the top and bottom, marking the highest and lowest prices during that timeframe. For example, a long lower wick on a daily candle in a retail stock like Shoprite suggests early selling pressure that buyers later took over, which can be a sign of support or a possible upward move.
Colours often help visualise market direction quickly. In most South African trading platforms, a green (or white) candle means closing price is higher than the opening price — buyers were in control. A red (or black) candle shows the opposite, with sellers dominating. That said, some traders might customise colours, so knowing your chart settings is vital. Also, patterns can look very different when you switch timeframes. A bullish pattern on a 15-minute chart might be insignificant on daily or weekly charts. Learning to read across multiple timeframes ensures you’re not overreacting to short-term noise — particularly important during volatile periods like times of loadshedding or unexpected rand fluctuations.
Candlesticks give you more than just direction; they show the battle between buyers and sellers, offering insight on momentum and potential turning points.
By mastering these basics, South African traders can start spotting meaningful patterns and improve timing in markets ranging from the JSE to forex or commodities like gold and platinum. This foundation sets the stage for understanding more complex candlestick formations that feed into practical trading strategies.
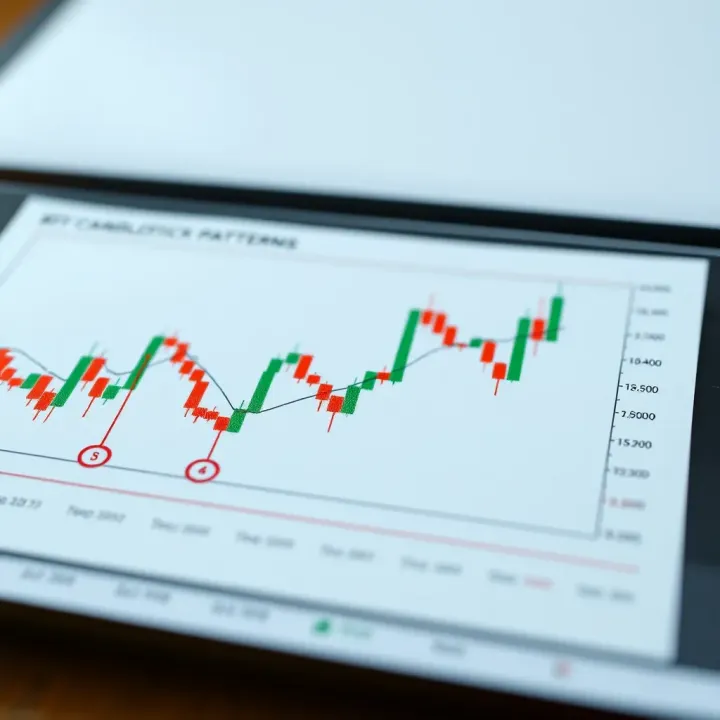
Understanding single candlestick patterns is a fundamental skill for traders navigating the JSE or international markets. These patterns provide quick insights into market sentiment during a specific trading session, helping you anticipate potential price moves without overcomplicating your analysis.
A Doji candle appears when the opening and closing prices are virtually the same, resulting in a very narrow or non-existent body. This signifies indecision between buyers and sellers, often reflecting a market at a crossroads. For example, if a Doji forms after a strong upward trend on the JSE Top 40 index, it may indicate the bulls are tiring and a reversal could be on the cards. However, the Doji on its own doesn’t confirm a trend change — watching what follows is crucial. A Doji during sideways movement usually suggests continuation rather than reversal.
Both the Hammer and Hanging Man have small bodies near the top of the candle and long lower wicks, but placement within the trend makes all the difference. A Hammer appears after a decline and often signals potential buying pressure starting to build. For instance, if you spot a Hammer on Sasol’s daily chart following a pullback, it may hint at a strong support level nearby. Conversely, the Hanging Man emerges at the end of an uptrend, indicating that sellers are beginning to push back, which can foreshadow a pullback or reversal. Spotting these patterns helps set up entry or exit points.
Spinning Tops feature small bodies with wicks on both ends, signalling indecision and a battle between bulls and bears. These candles often appear in congested market phases, such as in shares listed on the JSE during low liquidity periods like December holidays. While they don't predict clear direction, Spinning Tops warn that the current price movement lacks conviction. Traders should use them alongside volume or momentum indicators for confirmation.
Single candlestick patterns offer a snapshot of daily sentiment but are most powerful when combined with broader market context and other technical tools.
By recognising these key candlestick patterns, you can sharpen your timing and better interpret the mood of the market. This not only makes your trading decisions more informed but also helps manage risk during uncertain periods.
Spotting multiple candlestick patterns can give traders a richer picture of market sentiment than single candles alone. These patterns often reflect the tug-of-war between buyers and sellers over several sessions, making them valuable for confirming trend changes or continuations on the JSE or any other market. When you recognise these patterns, you get clues about possible reversals or the strength behind a move, helping you decide when to enter or exit trades more confidently.
Engulfing patterns show up when a candle's body completely covers the previous candle’s body. In a bullish engulfing, a small red (down) candle is followed by a large green (up) candle that “engulfs” it. This suggests buyers have taken control, often signalling a potential trend reversal to the upside. Conversely, a bearish engulfing pattern forms when a green candle is swallowed by a larger red candle, indicating sellers are gaining ground.
For example, say you’re watching Naspers shares and notice a bullish engulfing at a key support level. That could hint at a bounce, especially if volume rises, confirming stronger buyer interest. But don’t rely on this pattern alone—pair it with other factors like volume or RSI to reduce false signals.
These three-candle patterns are classic signals of reversals, seen regularly on slower moving stocks. The morning star features a long red candle, a small-bodied candle (often a doji), then a long green candle moving higher. This sequence reflects selling pressure tapering off before buyers push prices up — a bullish sign.
The evening star is the mirror image, signalling the opposite. It starts with a green candle, followed by indecision, then a red candle that closes lower, hinting at an upcoming downtrend. For BHP Group on the JSE, spotting a morning star near a recent low could suggest a good chance to buy before the price turns upward.
These patterns unfold over three consecutive candles to reveal sustained momentum. The three white soldiers pattern consists of three long green candles, each closing higher than the last with little or no wicks. This strongly suggests buyers are firmly in charge. On the flip side, three black crows are three red candles in a row, indicating increasing selling pressure and a potential downtrend.
They are trustworthy when they appear after a clear trend or consolidaton. But keep an eye on the broader market context and volume — weak volume can weaken these signals. For instance, if trading Sasol shares during a rally, three white soldiers could confirm bullish momentum, but if volume is thin, it might just be a short-term spike.
Multiple candlestick patterns add layers of confirmation and help avoid jumping the gun on trades. Combining these with volume and other technical tools sharpens your sense for what the market is really up to.
Understanding and recognising these patterns gives you an edge trading the JSE or other financial markets. They’re most effective when paired with smart risk management and considering overall market conditions.
Trading candlestick patterns effectively requires more than just identifying them on a chart. To make them truly useful, you need to integrate these signals into a broader strategy that considers volume, other technical indicators, and sound risk management. This approach helps you avoid knee-jerk reactions and better navigate the JSE’s sometimes volatile movements.
Candlestick patterns can be misleading when taken alone. Volume offers crucial confirmation. For instance, a bullish engulfing pattern that appears on low volume may lack the strength for a reliable trade entry. However, if the same pattern shows rising volume, it suggests genuine buying interest. Similarly, pairing candlestick analysis with moving averages or the Relative Strength Index (RSI) can help you avoid false signals. For example, a hammer at a support level confirmed by the RSI moving out of oversold territory increases the odds of a reversal.
Volume and complementary indicators act as your safety net, confirming whether a candlestick pattern points to a meaningful shift or just noise.
Once you confirm a pattern’s validity, the next step is to define precise entry and exit points. Suppose you spot a morning star pattern on the Sasol share chart, signalling a potential bullish reversal. A practical entry point is just above the high of the confirmation candle once it closes. To manage risk, set your stop-loss just below the low of the entire pattern. Exits can be planned using previous resistance levels or by tracking trailing stops once the trend develops. Defining these levels in advance keeps emotions in check and guards your capital.
No pattern guarantees success, which is why risk management is vital. Limit your exposure per trade to a small percentage of your trading capital—often 1% to 2% is wise. This means if your stop-loss triggers, you don’t lose more than you can afford. Additionally, don’t rely solely on candlesticks; watch for market events unique to South Africa, like sudden Rand volatility or load shedding schedules that might disrupt liquidity. Also, diversify your trades—don’t put all your eggs in one basket.
By combining confirmed candlestick signals with clear entry-exit plans and strict risk controls, you increase the likelihood of consistent, disciplined trading that can withstand the bumps of the local and global markets.
When applying candlestick patterns in trading, many traders jump the gun and miss factors that could affect the reliability of these signals. Stepping back to recognise common mistakes can save you from costly errors on the Johannesburg Stock Exchange (JSE) or other markets.
Relying just on a candlestick pattern without considering the market’s bigger picture often leads to wrong trades. For example, spotting a hammer candle signalling a possible upturn might be tempting, but if it occurs during a strong downtrend shaped by weak economic data or Eskom-related risks, the signal loses strength. Context includes overall trend, market sentiment, macroeconomic news, or events like loadshedding announcements that can swing trading volumes. Without placing a pattern in its proper setting, you’re like a sailor steering by a single star – chances are you’ll drift off course.
Candlestick patterns are rarely stand-alone signals. Traders new to candlestick analysis often act on the first sign, such as a bullish engulfing candle, expecting an immediate price surge. However, confirmation through volume spikes, support or resistance levels, or indicators like the Relative Strength Index (RSI) helps filter false signals. Imagine the JSE reporting a bullish engulfing on Sasol shares but with low volume and no break of resistance — jumping in too soon could backfire. Use additional tools or wait for the next candle to confirm to avoid costly misjudgements.
A common trap is treating a pattern the same on a 5-minute chart as you would on a daily or weekly chart. Candlesticks on shorter time frames can create noise and produce misleading signals. For instance, a doji on a 15-minute session might mean indecision within that brief period but doesn’t hold much weight on a daily chart for long-term decisions. Adjust your interpretation based on your trading horizon: scalpers and day traders focus on quick setups, whereas position traders look for patterns that stand out over days or weeks.
Avoiding these pitfalls improves your edge, reduces emotional responses to every candle, and promotes disciplined trading — essential traits for navigating South Africa’s sometimes volatile market conditions.
Being aware of the broader market environment, waiting for confirmation, and matching patterns to your time frame can make candlestick trading more reliable and profitable.
📈 Master candlestick patterns for smarter trading. Learn how to spot market shifts, improve entries and exits with clear guides on price action signals. 📊
🔍 Learn to spot hammer candlestick patterns in trading! Understand their signals, use with other indicators, and trade stocks or forex more effectively.

🔍 Find the perfect trading app in South Africa by comparing features, security, fees, ease of use, and local support to trade smart and safe.
📈 Discover key insights on forex trading in South Africa! Learn about market rules, top platforms, risks, and tips to trade smarter locally. 🇿🇦💹
Based on 7 reviews