
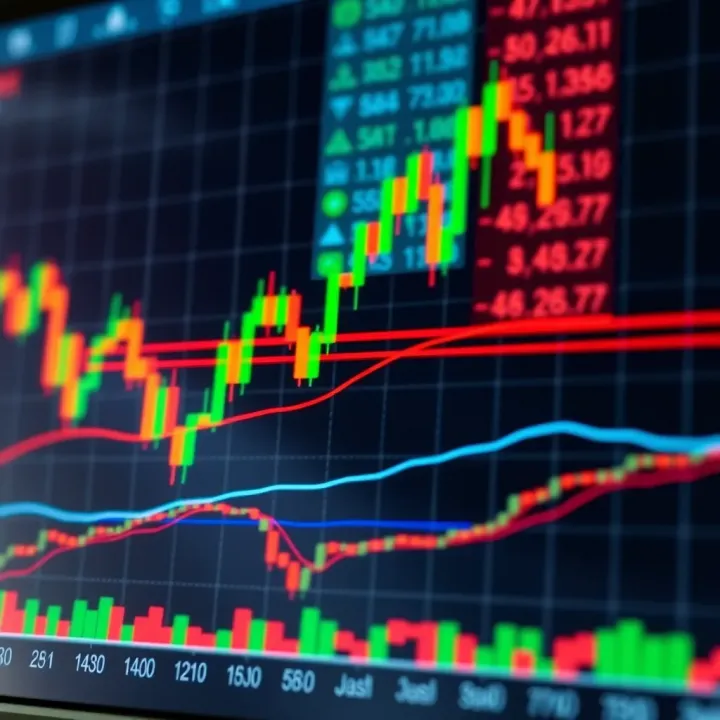
Understanding Forex Trading Signals in South Africa
📈 Learn how forex trading signals help South African traders make informed decisions. Discover types, costs, risks, and tips for smart signal use in FX trading.
Edited By
Hannah Mitchell
In forex trading, candlestick patterns offer a straightforward way to gauge market sentiment and price action. Unlike plain line charts, candlestick charts display more detailed information in a compact format — opening and closing prices, highs and lows, and the direction of price movement within a specific timeframe. This clarity helps traders make smarter decisions.
Candles consist of a body and wicks (or shadows). The body shows the price range between the open and close, while the wicks reveal the extremes of price during that period. For example, a long body signals strong buying or selling pressure, while short bodies usually mean indecision or consolidation.

Understanding key candlestick patterns is vital. Patterns such as the bullish engulfing, hammer, shooting star, and Doji reveal potential reversals or continuations in price. Recognising these enables you to enter or exit trades with better timing.
Candlestick patterns aren't foolproof but serve as practical guides when combined with other analysis tools and risk management.
For South African forex traders, spotting these patterns on local or global currency pairs can improve timing in the market, especially during volatile periods caused by factors like international news or local economic events. Practical learning often involves using PDF guides or charting software that allows you to visually compare patterns against historical data.
How candle anatomy reflects trader behaviour
The meaning behind popular patterns
How to read patterns in context, not isolation
The importance of volume and trend alongside patterns
By honing your skills in reading candlestick charts, you can make more confident, data-driven decisions. This groundwork sets you up to explore advanced patterns and strategies that impact your bottom line, particularly within South Africa’s unique forex environment.
Candlestick charts are a cornerstone tool for forex traders because they provide detailed visual insights into price movements beyond what simple line charts offer. Unlike basic representations, candlestick charts show the open, high, low, and close prices within a specific timeframe, assisting traders in spotting market sentiment shifts quickly. For instance, if you’re trading the USD/ZAR pair during an active session in Johannesburg, these charts help reveal whether buyers or sellers control the market at any moment.
Each candlestick summarises price action for a chosen period, be it one minute, one hour, or one day. The main components—body and wicks—depict how prices opened and closed, as well as the extremes they reached within the period. A long body with a higher close signifies bullish pressure, while a long body that closes near the low indicates bearish sentiment. This snapshot guides traders whether to enter or exit positions with greater confidence.
Unlike other charts, candlesticks communicate the tug-of-war between bulls and bears elegantly and intuitively.
Line charts simply connect closing prices, offering a smooth but less informative view that misses intra-period volatility. Bar charts show similar information to candlesticks but lack the visual clarity that colours and shapes provide. Candlestick charts use colour (usually green or white for up, red or black for down) to instantly flag market direction, making it easier to digest large amounts of data. This makes candlesticks particularly useful during volatile sessions or when following sudden news impacts.
To read candlesticks effectively, understand their anatomy:
Open: The price at the start of the trading period
Close: The price at the period’s end
High: The maximum price during that period
Low: The minimum price during that period
The rectangular body forms between the open and close, and the lines above and below it are the upper and lower wicks (or shadows), representing highs and lows. For example, in a 1-hour GBP/ZAR candle, a long wick above a small body suggests price rejection at higher levels, hinting at potential reversals.
Grasping these basics sets the foundation for spotting patterns that reflect market psychology, which is invaluable for making smarter forex trading decisions.
Understanding key candlestick patterns is essential for forex traders aiming to make informed decisions in fast-moving markets. These patterns reveal shifts in trader sentiment and potential price direction, often signalling entry or exit points. Knowing which single and multiple-candle patterns to spot can help you react quickly, avoiding costly mistakes.

The hammer and hanging man look similar but appear in different contexts. A hammer typically surfaces after a downtrend, showing rejection of lower prices and hinting at a possible reversal upwards. For example, if the USD/ZAR pair falls sharply then forms a hammer (a small body with a long lower wick), it suggests buyers are stepping in locally. On the flip side, a hanging man emerges after an uptrend and warns that sellers might take control soon. Traders often check other indicators before acting on these patterns to confirm the shift.
Doji candles represent indecision in the market as the opening and closing prices are almost the same. Different variations like the long-legged doji or dragonfly doji reflect subtle differences in market psychology. In practice, seeing a doji at the top of an upward move—for example, in EUR/USD—signals that the buying momentum might be fading. Doji patterns alone are not enough: traders should wait for confirmation from the next candles or other tools like RSI or volume to avoid false signals.
Both candles feature long upper wicks, but context matters. A shooting star appears after an uptrend and signals that buyers tried to push prices higher but failed, which may lead to a reversal or pullback. For instance, if the GBP/ZAR chart shows a shooting star on the daily candle, it could hint the rally is stalling. Conversely, an inverted hammer shows up after a downtrend, suggesting buyers are beginning to challenge sellers. This pattern might invite cautious long positions when combined with strong support levels.
Bullish engulfing patterns start with a small bearish candle followed by a larger bullish candle that covers the former’s body. They signal buyers gaining the upper hand—useful to spot trend changes early. For example, a bullish engulfing pattern on the USD/ZAR hourly chart after a steady drop might mark the start of strong upward momentum. The bearish engulfing pattern is the opposite, warning of impending reversals from bullish to bearish trends.
These are three-candle combinations signalling sharp reversals. A morning star forms at the bottom of a downtrend: it starts with a bearish candle, followed by a small-bodied candle (signalling hesitation), and ends with a strong bullish candle. Traders often use it to confirm the end of selling pressure. The evening star is its bearish counterpart, signalling a reversal from uptrend to downtrend. These patterns are more reliable if volume increases on the final candle, showing strong conviction.
The three white soldiers pattern consists of three consecutive long bullish candles, each closing higher than the previous, marking sustained buying pressure. It’s a sign the market is trending firmly upwards, useful in confirming breakouts or trend reversals in pairs like EUR/ZAR. The three black crows pattern is its bearish twin, signalling persistent selling and possible continuation of a downtrend. Both patterns demand care: appearing after prolonged trends, they may indicate exhaustion rather than continuation.
Recognising these key candlestick patterns helps forex traders interpret price action clearly, supporting smarter entry and exit points in South Africa’s forex markets. Always combine pattern analysis with trend context and risk controls for effective decision-making.
Mastering candlestick patterns can boost your forex trading significantly, but their value lies in how you use them alongside other tools. Candlestick patterns are not the whole story—combining them with broader market analysis helps you make smarter, more reliable decisions. Let's break down how to get the most out of these patterns.
Candlestick patterns show potential turning points or continuation cues, but context matters. For example, spotting a bullish engulfing pattern is promising, but its reliability jumps when it fits into an existing uptrend or signals a reversal after a clear downtrend. Think of it like reading road signs while driving—you need to know if you're heading uphill or downhill to react accordingly.
A practical way to combine trends is by using moving averages or trendlines to confirm the direction. If a shooting star appears during a strong uptrend, it could hint at a pause or pullback rather than an outright reversal. This kind of layering reduces false signals and helps you avoid chasing weak moves.
Candlestick signals can’t be treated like guarantees. Always confirm patterns with other indicators like RSI, MACD, or volume metrics. For instance, a morning star pattern followed by an oversold RSI reading carries more weight than the pattern alone.
Risk management here is non-negotiable. Stick to sensible stop-loss levels—placing stops just beyond recent highs or lows related to the candlestick formation can protect you from sudden volatility. A R1,000 trade shouldn’t risk more than R50, say, protecting your bankroll over the long haul.
Also, consider confirmation on higher timeframes. A hammer on a 15-minute chart may be more meaningful if the daily chart supports a bullish setup. This multi-timeframe approach adds robustness to trading decisions.
Traders often fall into a few traps when using these patterns. One is reading too much into single candles without regard for overall price action. Like trying to predict the weather from one cloud, it's rarely reliable.
Another mistake is ignoring the market context—jumping into trades just because a pattern formed, without checking the trend or fundamental backdrop, often leads to losses. For example, a bearish engulfing in a strong uptrend might only signal a short pause, not a downtrend.
Lastly, neglecting stop losses or confirmation can turn a seemingly perfect setup into a money pit. Candlestick patterns are tools, not magic. Using them wisely, with patience and proper risk controls, will improve your forex trading outcomes significantly.
Using candlestick patterns effectively means blending them with trend insights, confirmation indicators, and solid risk management. It’s all about stacking the odds in your favour rather than chasing quick wins.
By integrating these practical approaches, you’ll read your charts better and trade with more confidence, whether you’re monitoring the rand-dollar pair or any other forex market active in South Africa.
Candlestick pattern PDFs provide traders with a handy, offline resource to deepen their understanding of chart reading. These guides often condense complex information into clear diagrams and step-by-step explanations, making it easier to spot profitable setups while trading forex. Having these resources on hand means you can revise patterns anytime, especially when the data connection is patchy or during long trading sessions away from your usual setup.
Look for PDFs from reputable industry sources like established forex education websites, brokerage firms, or renowned trading coaches. Many South African brokers servicing local clients, such as IG or ThinkMarkets, offer educational material tailored to forex traders. Publicly shared resources from trading communities or platforms such as BabyPips often come with solid reviews and practical examples. Avoid downloading random PDFs from unknown sites, as these may contain outdated information or misleading advice.
Approach these PDFs as interactive tools rather than just reading material. Start by reviewing basic candlestick shapes and their common meanings, then examine multiple-candle patterns with real chart examples. Following that, try to apply what you learn by identifying these patterns on your forex trading platform charts during live market hours. For instance, if a PDF explains the 'morning star' pattern, pause and look for similar formations on a currency pair like USD/ZAR or EUR/USD. This practice builds pattern recognition and boosts confidence.
Using PDFs alongside your trading platform turns theory into practical skill, cutting the gap between learning and trading decision-making.
To make PDF content truly useful, combine it with your existing trading plan. Use the PDF explanations to sharpen your entry and exit criteria for trades while also respecting risk management rules. For example, if a PDF highlights confirmation methods for a bullish engulfing pattern, always wait for confirmation signals like higher volume or trend alignment before placing trades. Additionally, maintain a journal where you note patterns identified from PDF study, whether they led to profitable trades or not. This habit not only reinforces memory but also highlights which patterns work best in specific market conditions, relevant to South African forex markets influenced by global movements and local economic factors.
By systematically accessing and utilising quality candlestick pattern PDFs, you build a solid foundation that supports ongoing learning while sharpening your real-time decision-making skills in the forex market.
Grasping candlestick patterns provides a firm foundation for making smarter forex trading decisions. Understanding how these patterns reflect market psychology can improve your ability to anticipate price movements, reducing guesswork and boosting confidence in your trades. For instance, spotting a hammer after a downtrend can hint at a potential reversal, signalling a good entry point. This is particularly relevant in the South African forex context, where currency volatility and external factors often influence price swings.
Candlestick charts are more than just pretty pictures; they carry valuable information about market sentiment. Single-candle patterns like the Doji or Hanging Man reveal indecision or potential reversals, while multiple-candle formations such as Bullish Engulfing or the Morning Star confirm shifts in trend direction. Combining these patterns with broader analysis tools—such as trendlines or support and resistance levels—strengthens their predictive power. Never ignore risk management: always wait for confirmation signals before acting, and set clear stop-loss orders to protect your capital.
Building proficiency with candlestick patterns takes practice and patience. Start by tracking a few currency pairs on daily and hourly charts, noting how patterns unfold in live markets. Use South African-focused trading platforms like Standard Bank Forex or FNB’s trading app to access real-time data. Supplement this with PDF guides or tutorials from respected sources like MyBroadband or BusinessTech to deepen your understanding. Over time, combine candlestick insights with fundamental analysis, such as local economic releases or SARB decisions, for a fuller market picture. Lastly, keep a trading journal to record your observations and refine your strategies based on actual results.
Candlestick patterns work best when viewed as signals within a bigger trading framework — treat them as tools that guide you, not as magic bullets.
Applying these principles consistently will enhance your chart reading skills and improve your edge in South Africa’s dynamic forex markets.
📈 Learn how forex trading signals help South African traders make informed decisions. Discover types, costs, risks, and tips for smart signal use in FX trading.

🔍 Learn to spot hammer candlestick patterns in trading! Understand their signals, use with other indicators, and trade stocks or forex more effectively.
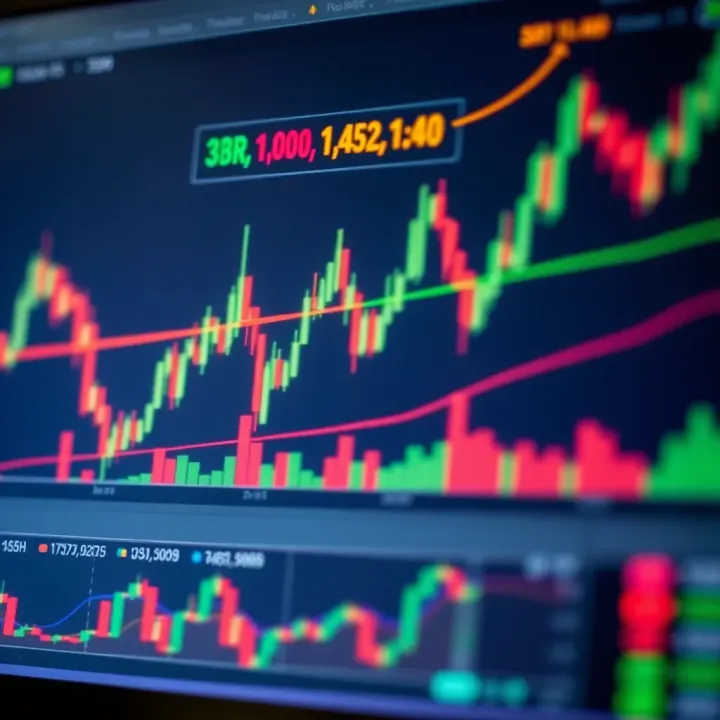
📈 Explore forex trading systems in South Africa! Learn how strategies, indicators, risk management & automation work together to boost your trading results.

🔍 Discover the essentials of forex trading in South Africa, from market basics and currency factors to smart strategies and risk tips for investors!
Based on 5 reviews