

Forex Reversal Candlestick Patterns Explained
📈 Learn to spot key forex reversal candlestick patterns and improve your South African trading edge. Essential tips help anticipate market shifts with confidence in Rands.
Edited By
Emily Sutton
Forex candlestick patterns offer a straightforward way to read market sentiment and timing without drowning in overly complex charts. These visual tools distil price action into shapes and colours that traders can quickly interpret, crucial for making swift decisions in fast-moving markets like forex.
In South Africa, where volatility often spikes due to local economic shifts and global influences alike, understanding these patterns helps traders manage risk and seize the right moments to enter or exit trades. But candlestick patterns won’t deliver success on their own — they need to be combined with context, like overall trends, support and resistance levels, and volume.
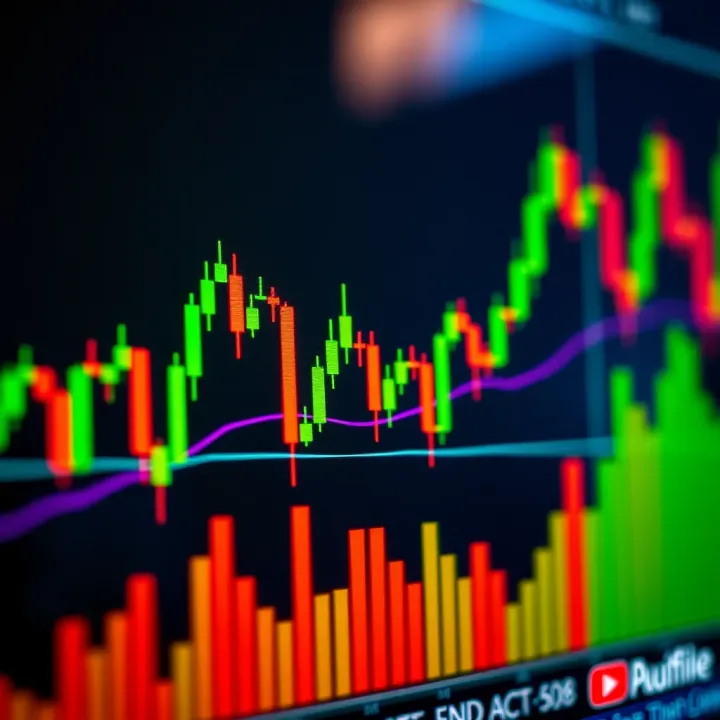
Candlesticks are basically price bars representing a specific time period — such as 1 hour, 4 hours, or daily — showing the open, close, high and low prices. When you see a few candlesticks together forming a pattern, that hints at potential market turning points or trend continuations.
Some patterns are more reliable than others. For example, the bullish engulfing pattern, where a small red candle is followed by a larger green candle completely covering it, often signals a bullish reversal. Conversely, the shooting star can warn of a bearish reversal after an uptrend. Still, no pattern is foolproof — confirming them with indicators or price action nearby helps reduce false signals.
Learning to identify and interpret forex candlestick patterns is an essential skill for anyone trading in South Africa’s forex market. They provide a visual narrative that can improve trade timing and confidence.
By combining candlestick pattern knowledge with a solid trading plan and strict risk management, you stand a better chance of navigating the sometimes choppy waters of forex trading. The following sections will explain key patterns, how to spot them effectively, and practical tips for using pattern PDFs and visual aids in your daily trading routine.
Grasping the fundamentals of forex candlesticks is essential for any trader aiming to interpret price action clearly and make sound decisions. Candlestick charts condense a lot of information into a simple visual format, allowing you to see more than just the current price — you get a snapshot of trader sentiment and market momentum.
Each candlestick is made up of a body and two wicks (sometimes called shadows). The body reflects the range between the opening and closing prices during a set period — for instance, one hour or one day. If the closing price is higher than the opening, the candle is bullish and usually coloured green or white; the opposite indicates a bearish candle, typically red or black. The wicks show the highest and lowest prices during that time, offering clues about price rejection or acceptance at certain levels.
The way price moves within the timeframe shapes the candlestick's appearance. A long upper wick might suggest sellers pushed the price down after an attempt to rise, whereas a long lower wick shows buying pressure after a drop. A candle with a small body and long wicks at both ends, like a doji, signals indecision, often preceding reversals. Reading these shapes gives traders insight into how buyers and sellers battle it out.
Bullish candles form when buyers control the market, pushing prices up through the period, reflecting positive sentiment or momentum. Bearish candles tell the story of sellers dominating, driving prices lower. Spotting clusters of bullish or bearish candles can indicate a strengthening trend, while mixed candles might warn of consolidation or a looming reversal.
Candlestick charts help traders to visualise price information quickly. Unlike plain line charts, which only track closing prices, candlesticks display four key data points—open, close, high, and low—making it easier to spot market action at a glance. For instance, when volatility spikes during South African Rand movements against the US Dollar, the size and shape of candlesticks can signal how strong the move really is.
These charts are also valuable for identifying shifts in market sentiment. A sudden appearance of hammer candles after a downtrend might mean buyers are stepping in, providing an early warning for potential trend reversals. Similarly, bearish engulfing candles can suggest sentiment is turning negative, prompting traders to adjust their positions swiftly.
Candlesticks don't work in isolation — they complement other technical tools. Used alongside support and resistance levels, moving averages, or the Relative Strength Index (RSI), candlestick patterns become more reliable. For example, a bullish engulfing pattern near a support line combined with an oversold RSI reading enhances confidence in entering a long position. It’s like having multiple safety nets before taking the leap.
Mastering candlestick basics lays the groundwork for sharper analysis and better timing in the forex market, especially when navigating Rand volatility or varied global events.
Understanding these core aspects brings you one step closer to reading the market’s language fluently.
Understanding key forex candlestick patterns offers traders a useful toolkit for interpreting market moves without relying only on numerical data. These patterns reveal shifts in sentiment and potential reversals by visualising how buyers and sellers interact. Knowing them helps you spot entry and exit points more confidently in both trending and sideways markets.
Doji and its variations are candles where open and close prices are nearly equal, resulting in a tiny or non-existent body. They signal indecision and a tug of war between bulls and bears. In volatile conditions, spotting a doji after a sustained price move often hints at possible reversal or pause. For example, on a USD/ZAR chart after a strong rally, a doji might warn that buyers are losing steam.
Hammer and Hanging Man look similar with a small body and long lower wick but differ by context. The hammer appearing during a downtrend suggests a potential bullish reversal as sellers failed to push prices lower. Conversely, a hanging man near a peak warns of selling pressure creeping in. These patterns are handy for pinpointing where momentum could shift but should be confirmed with volume or trend support.
Shooting Star and Inverted Hammer form with a small body and long upper shadow. The shooting star at the top of an uptrend usually signals sellers might take over, while the inverted hammer during a downtrend might mark a turning point upwards. They highlight failed attempts to push prices further in the current direction, so traders often watch the next candle closely to confirm.
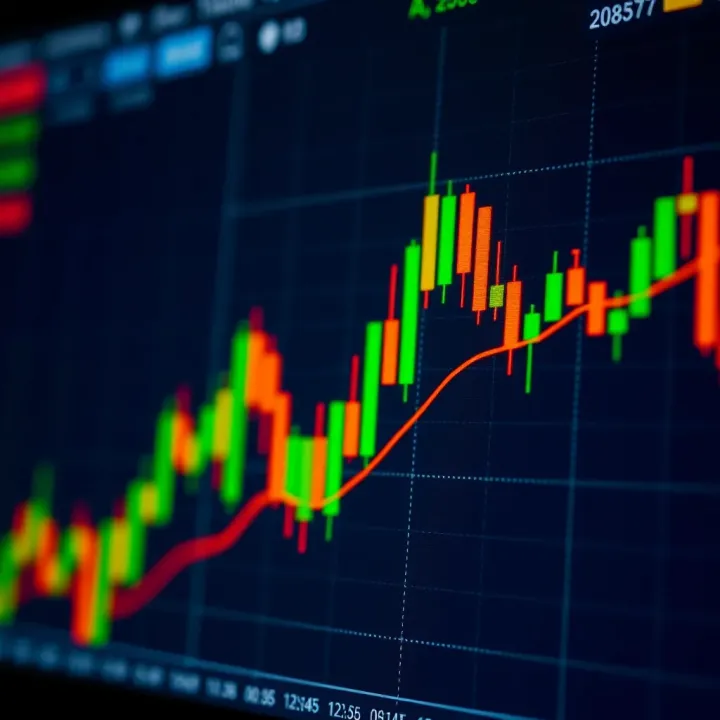
Bullish and Bearish Engulfing patterns involve one candle completely covering the previous candle’s real body. A bullish engulfing appears after a decline and suggests buyers overwhelmed sellers, signalling a possible trend change upwards. The bearish version after an uptrend points to sellers gaining control. Because they flip the previous candle’s narrative so clearly, these patterns are especially dependable for spotting reversals.
Harami and Harami Cross involve smaller candles contained within the prior larger candle’s body. Harami indicates hesitation and a potential shift in momentum without outright dominance. The Harami Cross, where the second candle is a doji, intensifies this uncertainty. They're subtle compared to engulfing candles but can help you anticipate quieter moments before the market picks a new direction.
Piercing Line and Dark Cloud Cover are two-candle patterns showing initial resistance followed by a reaction. A piercing line forms when a bullish candle retraces more than halfway into the prior bearish candle, signalling strong buying. Dark cloud cover does the opposite in an uptrend, triggering a possible pullback. These patterns are useful for spotting near-term corrections within larger trends.
Morning and Evening Stars are three candle patterns signalling major shifts. The morning star appears after a downtrend with a small-bodied middle candle separating a bearish and then a bullish candle, marking a likely bottom. Evening stars near a peak indicate a potential top with the middle candle often being a doji or small body. These patterns provide stronger, multi-candle confirmation than single or two-candle setups.
Three White Soldiers and Three Black Crows show three consecutive candles moving in the same direction with little to no wicks. The white soldiers indicate strong bullish momentum, often after a pullback, while the three black crows signal a potent bearish push after a rally. Spotting these formations can highlight sustained runs and alert you to momentum exhaustion points.
Rising and Falling Three Methods are continuation patterns made up of a long candle, followed by several small counter candles, then another long candle continuing the trend. Rising three methods confirm bullish continuation, while falling three methods suggest the bearish trend will carry on. These patterns help riders of a trend stay in the market through short pauses.
Recognising these patterns and blending them with broader market context improves trade decision-making, reducing guesswork and enabling you to respond quickly to changing forex market sentiment.
Reading candlestick patterns is only the start; interpreting them within the forex market context makes all the difference. Patterns alone don’t guarantee success—understanding how they fit alongside trends, volume, and key price zones helps avoid costly mistakes. For instance, a bullish engulfing pattern near a strong support line carries more weight than the same pattern appearing mid-trend with low volume. Without this context, traders risk jumping into trades based on signals that aren’t reliable on their own.
Volume acts as the pulse of the market, telling you how many participants back a particular price move. A candlestick pattern backed by high volume tends to be more trustworthy because it signals genuine interest. For example, a hammer candle at the bottom of a downtrend accompanied by a surge in volume could indicate a meaningful reversal rather than just a brief pause.
Trend direction also matters hugely. Trading against the prevailing trend based solely on a contrarian candlestick signal is risky. If the market is clearly down, spotting a bullish pattern doesn’t mean you should jump in blindly. Instead, use patterns as confirmation tools within the bigger picture—look for trades that align with the direction, or wait for clear signs that the trend itself is shifting.
Support and resistance zones tighten entries further. Patterns forming near these levels gain significance because they reflect battles between buyers and sellers. Say you spot a piercing line pattern at a historical resistance level; that might warn of a breakout or rejection. Filtering trades this way improves risk versus reward and cuts down on false signals.
One of the biggest traps is relying on candlestick shapes without considering the broader market context. Patterns don’t work in isolation. Treating a doji or engulfing pattern as a guaranteed reversal without checking momentum, volume, or trend setting is like navigating the veld without a compass—it’s easy to get lost.
Misreading the candle’s wicks and bodies is another frequent error. A long upper wick on a candle close to resistance may indicate selling pressure, while a long lower wick near support hints at buyers stepping in. Confusing these subtle clues leads to poor timing and wrong trade entries.
Finally, ignoring other indicators is a costly oversight. Price action alone offers valuable insight but combining candlestick readings with tools like RSI, moving averages, or Fibonacci levels provides a fuller view. It’s about knowing when a pattern lines up with other signals to confirm the market’s mood rather than chasing patterns on their own.
Interpreting candlestick patterns with volume, trend, and price levels in mind helps make smarter, more informed trading decisions.
Understanding these layers cuts through the noise traders often fall prey to. It’s not about spotting patterns; it’s about placing them in the right market story.
Candlestick pattern PDFs offer a handy reference for traders who want to spot key signals without sifting through messy notes or lengthy tutorials. Having a reliable, easy-to-access PDF saves precious time during live forex sessions where quick decision-making counts. Let's unpack how such resources can fit into your trading routine.
Quick recognition during live trading
In the thick of a trading session, it's tempting to second-guess pattern interpretations. A pattern reference PDF acts like a cheat sheet, helping you instantly identify candlestick setups like hammers or engulfing patterns. For instance, if a bullish engulfing pattern forms on the USD/ZAR chart, quickly confirming the pattern's shape and criteria in your PDF can reduce hesitation and improve your trade timing.
Review and study for better memory retention
Outside trading hours, revisiting pattern PDFs sharpens your understanding. Consistent review turns the jumbled shapes into muscle memory. This is particularly useful when you’re juggling multiple currency pairs or learning new pattern variations. Keeping a PDF handy on your desktop or mobile means you can sneak in some study during breaks or commuting.
Comparing patterns side-by-side
Not all candlestick patterns look alike, and some can be confused easily—like the hammer and the inverted hammer. A well-organised PDF puts these patterns next to each other, highlighting subtle differences. This visual comparison aids in distinguishing the patterns and knowing when a signal is reliable or one to treat with caution.
Printing vs digital use on mobile or desktop
Choosing the format depends on your trading environment. Printing the PDF provides a tactile experience, handy for those who prefer quick glances away from screens or when power interruptions hit — common during loadshedding. On the other hand, digital versions on tablets or mobiles provide searchability and portability, letting you zoom in on details and highlight parts on the fly.
Highlighting patterns relevant to your strategy
Focus on patterns that align with your trading plan. For example, if you specialise in short-term intraday trades, mark those single-candle signals known for quick reversal indications. Highlighting these in your PDF ensures you zero in on what matters most, preventing information overload.
Regularly updating your reference material
Forex markets evolve and so do strategy preferences. Keep your PDFs up to date with the latest research, strategy tweaks, or even new pattern discoveries. This practice keeps your trading fresh and avoids clinging to outdated signals that may no longer be as reliable under current market conditions.
Having a well-curated, regularly updated candlestick pattern PDF is like carrying a trusted trading partner—always ready to help you read the price action clearly and confidently.
Integrating these tips into your routine is a straightforward way to make candlestick trading cleaner, smarter, and ultimately more effective in the South African forex market.
Using candlestick patterns in South African forex trading means more than just recognising shapes on a chart. It requires understanding local market conditions that influence price movements and adapting your trading approach accordingly. This practical skill helps traders make better decisions, especially when the rand (ZAR) has its own quirks and risks.
The rand is known for its wild swings and vulnerability to local political and economic events. For example, unexpected changes in government policy or fluctuations in commodity prices often cause rapid rand movement against the US dollar or euro. This volatility makes candlestick patterns particularly valuable—they can signal shifts in market sentiment during noisy conditions. If you notice a bullish engulfing pattern forming on the USD/ZAR chart after a period of selling pressure, it could hint that local traders are starting to buy the dollar again amid rand weakness.
Loadshedding adds an unusual challenge for South African traders. Scheduled power cuts can disrupt access to trading platforms, especially during peak times for forex volatility. Many traders adapt by planning trades outside typical loadshedding windows or by setting alerts and stop orders in advance. Understanding this local factor means you won't miss key candlestick signals simply because your internet or power failed. Some also rely on mobile data bundles or interrupted power solutions to stay connected during load interruptions.
Choosing a broker registered with the Financial Sector Conduct Authority (FSCA) offers protection and smoother transactions for South African traders. Local brokers often provide direct ZAR accounts, reducing conversion fees and delays. Many platforms like IG South Africa, Plus500, and ThinkMarkets accommodate forex trading with popular local payment methods—EFT, credit cards, or even SnapScan. Using these platforms means you can monitor candlestick patterns live with better feedback speeds, compared to some offshore brokers that have latency issues.
Candlestick patterns provide entry signals, but it's wise not to risk too much before you see confirmation. For instance, after spotting a morning star pattern on a GBP/ZAR chart, you might wait for the next candle to confirm the reversal before increasing position size. This cautious approach limits losses if the pattern fails. Position sizing based on the strength of the pattern and market conditions keeps risk manageable, especially given rand volatility.
Stop-loss orders protect your capital when trades move against you. The wicks of candlesticks often indicate price rejection levels—use these as logical points for your stops. If a hammer’s lower wick shows where buyers stepped in on an AUD/ZAR trade, placing a stop just below that wick helps avoid premature exit but limits heavy losses in case support breaks. This technique ties your risk level tightly to what the chart shows.
Knowing when to exit is just as important as when to enter. Candlestick patterns can guide exits too. Reversal patterns like the shooting star or bearish engulfing near resistance indicate it’s time to close or reduce your position. Combine these signals with your risk-reward targets for better overall trade management. In volatile times, like during rand swings or Eskom uncertainty, locking in profits quickly might avoid unexpected losses.
Successful South African forex trading hinges on tailoring candlestick knowledge to local realities, from rand movements and loadshedding to trusted brokers. Managing risk by adjusting position sizes and stop-losses around pattern signals keeps your trading sharper and more resilient.
By working with these practical considerations, you ensure your candlestick strategy isn't just theoretical but firmly grounded in the Mzansi trading environment.
📈 Learn to spot key forex reversal candlestick patterns and improve your South African trading edge. Essential tips help anticipate market shifts with confidence in Rands.
📈 Master candlestick patterns for smarter trading. Learn how to spot market shifts, improve entries and exits with clear guides on price action signals. 📊

📊 Master key candlestick patterns in forex trading! Learn how to interpret charts and make smarter decisions, with tips for traders active in South African markets 🇿🇦.
Master key forex chart patterns 📊 to predict currency moves and boost trades. Get free SA-focused PDF guides for simple, practical learning on your trading journey.
Based on 6 reviews